February 12 2018, By Chidi Rafael
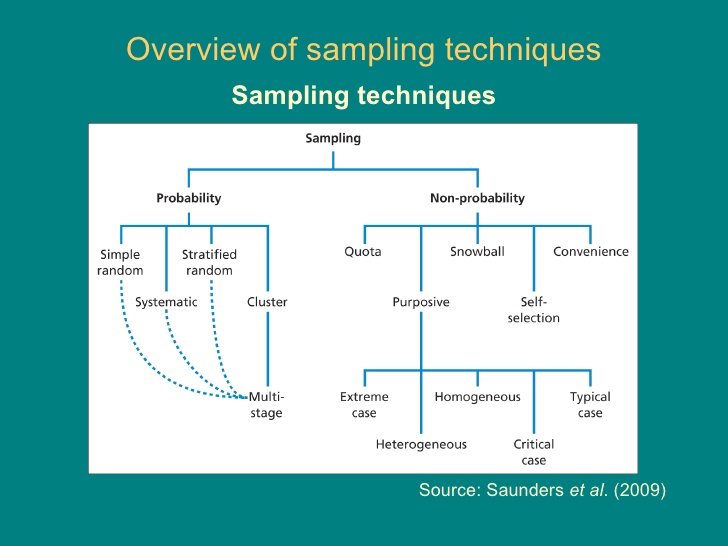
About to Write the Chapter Three (Research Methodology) of your Research paper? Are you comfused on the appropraite Sampling Technique to apply? If you are in this dilema Then, This short article is for you. Check out the diagrams below. It will help you decide on the best and most approriate sampling technique to apply for your research paper, dissertation, research project and thesis.
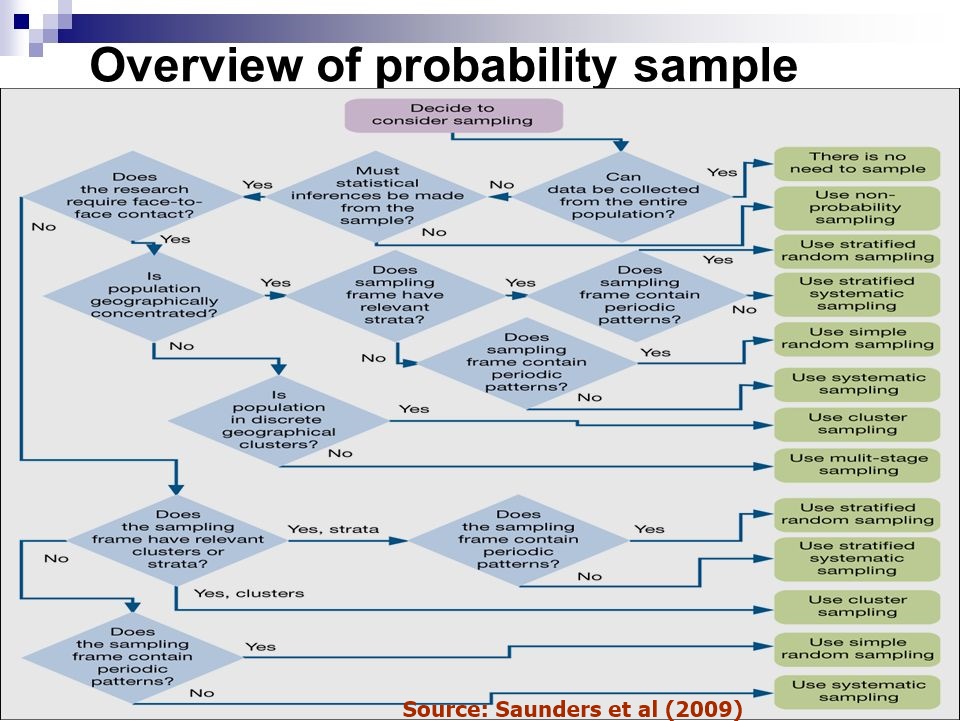
Check out the Link For More Detailed Explanation on Probability Sample
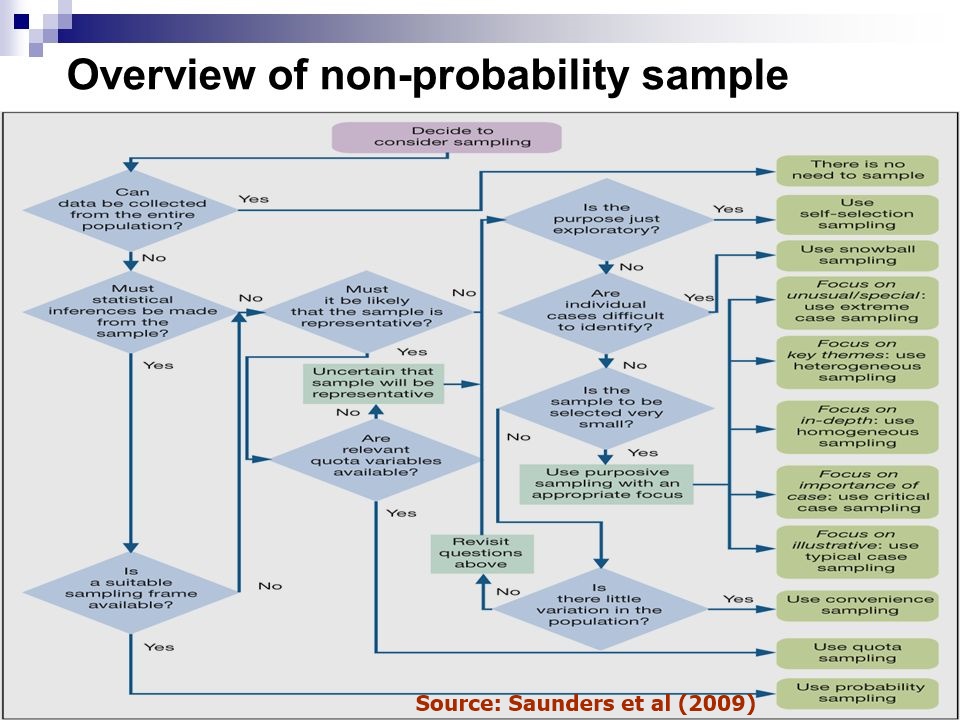
Check out the Link For More Detailed Explanation on Non-Probability Sample
A SAMPLE OF A TYPICAL CHAPTER THREE (RESEARCH METHODOLOGY) FOR BUSINESS ADMINISTRATION AND SOCIAL SCIENCES
CHAPTER THREE
RESEARCH METHODOLOGY
This chapter is concerned with the methodology used in achieving the objectives of the study. It covers research design, study area, population of the study, sample size, sampling techniques, instrument for data collection, sources of data collection, validity of research instrument, reliability of the instrument, administration of the instrument, method of data analysis and decision rule.
3.1 Research Design
This study employed the use of survey research design. The choice of this research design was considered appropriate because of its advantages of identifying attributes of a large population from a group of individuals. The design was suitable for the study as the study sought to examine subject matters using Company ABC as a case study.
3.2 The Study Area
This study was conducted in Company ABC. The choice of this study area was informed by its involvement in the subject matter in the state.
3.3 Population of the Study
The population of this study consisted of thirty (30) staff of Company ABC.
3.4 Sample Size and Sampling Techniques
As a result of the inability of the researcher to effectively study the whole staff strength (population) of the organisation, a representative number was chosen as the sample size population. Twenty Eight (28) staff was used as the sample size. The sample size was calculated using the Taro Yamane scientific formula which is given as:
n = N
1 + N (e) 2
Where:
N is the Population
1 is the constant
e is the degree of error expected
n is the sample size
n = 30
1 + 30 (0.05)2
30
1 + 30 (0.0025)
30
1 + 0.075
30
1 .075
n = 28
3.5 Sources of Data Collection
Data were collected from primary and secondary sources. Primary data were obtained through questionnaire and personal interviews with both management and senior staff of Company ABC. This method was adopted to enable detailed and independent information not covered by the questionnaire to be expressed by the respondents. Secondary data were obtained from published reports, books, internet, journals, newspapers and magazines. For analytical comparison of facts and proper compilation of facts and figures, survey of existing documents was deemed necessary.
3.6 Instrument for Data Collection
Data were collected through questionnaire carefully designed and administered to the respondents, as well as through personal interviews. On the whole, the questionnaire constituted the major instrument for data collection. The questionnaire contains sections A and B. Section A contains personal information about the respondents. Section B is the main body of the questionnaire. This section contains seventeen (15) close ended questions using a four (4) point scale instrument through which the opinions of the respondents were expressed. Their responses were measured by means of a four category rating system:
SA - Strongly agree 4
A - Agree 3
D - Disagree 2
SD - Strongly disagree 1
3.7 Validity of Research Instrument
The validity of the research instrument was assessed by the supervisor and other experts in the Faculty of Business Administration, University of University of ABC. These experts assessed the relevance of each item in relation to the objectives of the study, the hypotheses to be tested as well as the comprehensibility of each item in relation to the cognitive level of the respondents. They validated the instrument by effecting necessary corrections, examining the contents and ascertaining clarification of ideas as well as appropriateness of the items.
3.8 Reliability of the Instrument
Reliability in this context refers to the measure of consistency of the instrument used in eliciting relevant and desirable responses from respondents so that the objectives can be reliably and meaningfully achieved. In order to determine the reliability of the instrument used in the study, the corrected questionnaire was administered randomly on selected staff of Company ABC. This approach was repeated with the same group after a two – month’s period and the results obtained from the first and second pre-test were consistent, therefore, the instrument is reliable.
3.9 Administration of the Instrument
The questionnaire were personally administered by the researcher to the respondents during official hours at the office. The exercise was done with the help of head of operations of the organization. This enhanced return rate of above 70%.
3.10 Method of Data Analysis
Tables and simple percentage was used as technique of analyzing the research questions while chi-square was used to test the research hypotheses. All the tests were conducted at 0.05 level of significance.
3.11 Decision Rule
The decision to either reject or accept the null hypothesis (Ho) was reached using the following rules:
If the calculated value (t-cal) is greater than the table value (t-tab), the null hypothesis (Ho) will be rejected in favor of the alternative hypothesis (Hi) and if the table value (t-tab) is greater than the calculated value (t-cal) the alternative hypothesis (Hi) will be rejected in favor of the null hypothesis.
You may also like: Making Awesome Presentations│ Developing Outstanding Research Topics │How to Write an abstarct │How to Write a Project Proposal │How To Choose the Right Measurement Instrument